Understanding Market Cycles
Apr 19, 2025
Markets are more than numbers—they’re a reflection of human emotion, swinging between hope and despair as prices rise and fall. In 2025, with the S&P 500 in the midst of a significant correction following February’s highs, understanding these emotional swings is more critical than ever. At Vorpp Capital, we’ve been dissecting the market’s recent turbulence, and one framework keeps coming to mind: the market cycle, often visualized through tools like the “Wall St. Cheat Sheet” chart of investor psychology. This chart captures the rollercoaster of feelings market participants experience—from euphoria at the peak to panic at the trough—and offers a lens to gauge where we might be today. This article dives into the market cycle, describes the chart in detail, explores how investor emotions drive each phase, and connects it to our current environment. As we ponder whether this correction marks the bottom, the cycle of psychology provides a roadmap to what might lie ahead. Let’s break it down and see what it tells us about navigating 2025’s uncertainty.
What Are Market Cycles?
Market cycles represent the recurring patterns of price movements and investor behavior over time. They’re not just about charts—they’re about the collective psychology of market participants, from individual traders to institutional investors. Every cycle follows a similar arc: prices rise as optimism grows, peak as exuberance takes hold, decline as fear sets in, and bottom out when despair dominates, before hope sparks a new ascent. These cycles can span months, years, or even decades, driven by economic fundamentals, policy shifts, geopolitical events, and, most crucially, human emotion.
The “Wall St. Cheat Sheet” chart, titled “Psychology of a Market Cycle,” is a classic visualization of this journey. It plots price on the vertical axis and time on the horizontal, tracing a stylized market trajectory through distinct emotional phases. Accompanying the price curve is a bell-shaped “Simplified Market Cycle” graph, showing financial risk and opportunity across expansion, peak, contraction, and recovery. Each phase is labeled with the dominant sentiment—hope, optimism, euphoria, complacency, anxiety, denial, panic, capitulation, anger, depression, disbelief—alongside snippets of what investors might be thinking or saying at each stage. This chart isn’t a prediction tool; it’s a mirror, reflecting the emotional undercurrents that drive market swings. In 2025, with markets unsettled by trade tensions and economic slowdown, this framework helps us make sense of where we stand.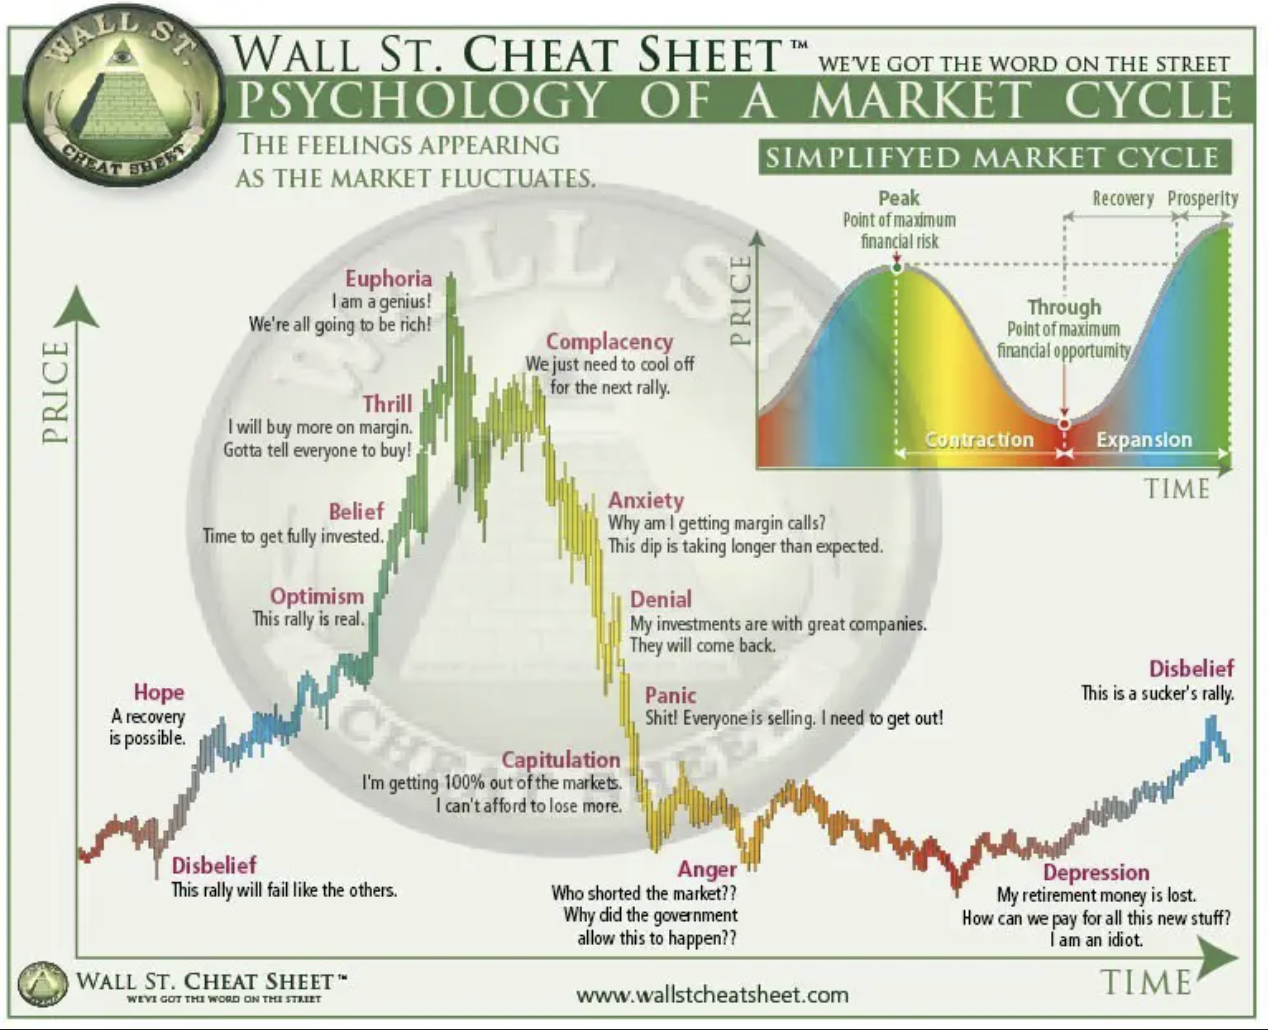
Describing the Chart: The Emotional Journey
The “Wall St. Cheat Sheet” chart begins at the bottom left, where prices are low and sentiment is bleak. The first phase, labeled “Disbelief,” captures the mood after a prolonged decline—investors mutter, “This rally will fail like the others.” As prices edge up, “Hope” emerges—a recovery feels possible, though skepticism lingers. The ascent steepens into “Optimism,” where confidence grows: “This rally is real.” Investors start to feel good, buying in as prices climb.
The curve accelerates into “Belief,” with thoughts like “Time to get fully invested.” The market’s momentum feels unstoppable, and “Thrill” takes over—investors are eager to buy more, often on margin, convinced the rally will continue. They urge others to join in, saying, “Gotta tell everyone to buy!” At the peak, “Euphoria” reigns supreme—prices hit their highest, and investors proclaim, “I am a genius!” or “We’re all going to be rich!” The chart marks this as the “Point of maximum financial risk,” where greed blinds reason.
Then the descent begins. “Complacency” sets in as prices dip slightly—investors shrug, “We just need to cool off for the next rally.” But the decline steepens, and “Anxiety” creeps in: “Why am I getting margin calls? This dip is taking longer than expected.” As losses mount, “Denial” takes hold—investors cling to hope, insisting, “My investments are with great companies. They will come back.” The drop accelerates into “Panic,” where fear dominates: “Everyone’s selling. I need to get out!” The chart labels this steep plunge as “Capitulation,” with investors declaring, “I’m getting 100% out of the markets. I can’t afford to lose more.”
At the trough, “Anger” emerges—investors lash out, asking, “Who shorted the market? Why did the government allow this to happen?” This gives way to “Depression,” where despair reigns: “My retirement money is lost. How can I afford all this new stuff? I am an idiot.” The cycle completes as prices inch up again, returning to “Disbelief”—a new rally begins, but few trust it. The simplified curve alongside shows risk peaking at euphoria and opportunity rising in depression, a reminder that the best buys often come when sentiment is darkest.
The Cycle of Investor Feelings: Why It Matters
The chart’s power lies in its depiction of investor psychology—emotions drive decisions, and decisions drive prices. Early in a cycle, hope and optimism fuel buying, pushing prices higher as more investors pile in. At the peak, euphoria blinds participants to risk; they overextend, often borrowing to chase gains. This sets the stage for the fall—complacency ignores early warnings, anxiety delays action, and denial keeps investors holding as losses grow. Panic and capitulation mark the bottom, where fear forces sales at the worst possible time, clearing the way for a new cycle.
This cycle matters because it’s universal—markets have followed this pattern for decades, from the 1929 crash to the 2008 financial crisis. In 2020, the S&P 500’s 34% plunge mirrored this arc: euphoria in February’s record highs gave way to panic by March, with capitulation at the bottom before a swift recovery. The chart doesn’t predict exact timing, but it highlights where sentiment might be steering us. In 2025, with the S&P in a correction since February, this framework offers clues about what’s next.
Where Are We in 2025?
Our last insight questioned whether the market had bottomed, and we leaned toward caution—too many risks, from economic slowdown to geopolitical tensions, suggested more pain ahead. The “Wall St. Cheat Sheet” reinforces that view. The S&P’s decline began in February, sparked by economic concerns, and was amplified by trade policy announcements in April. A recent bounce has some investors hopeful, but the chart’s phases suggest we’re in the “Complacency” stage—prices have dipped, then recovered slightly, and traders are thinking, “We just need to cool off for the next rally.”
This isn’t a bottom—it’s a pause. Complacency often precedes steeper declines, as investors underestimate the risks. Anxiety, denial, and panic typically follow, leading to capitulation—the true low where fear peaks and selling exhausts itself. In past cycles, bottoms came with raw emotion—2020 saw widespread panic, with investors fleeing en masse before the rebound. Today, trading activity is quieter, and volatility has eased, lacking the intensity of a capitulation moment. This aligns with our technical view: the market hasn’t shown the fear needed for a lasting low.
What’s Driving the Cycle in 2025?
Several forces are shaping this cycle, pushing us toward the next emotional phases:
- Economic Slowdown: The U.S. economy is cooling—growth is sluggish, and businesses are hesitant to invest. Consumer confidence is low, with spending on the decline. While inflation is easing globally, including in the U.S. due to a contraction in the money supply, this introduces new risks. Historically, such contractions have often led to recessions, and there’s a growing concern about deflation—falling prices that could discourage spending and deepen economic woes. A slide into recession or even a depression could intensify the downward leg of the cycle, driving investors from complacency to panic.
- Geopolitical Risks: Conflicts in Ukraine and the Middle East persist, while U.S.-Iran tensions add uncertainty. These aren’t directly spiking oil prices—oil is trending lower—but they create a backdrop of unease that keeps markets on edge.
- Trade Policy Uncertainty: The postponed trade measures still loom large. The administration’s vision of funding operations through import duties depends on negotiations with key players like China and the EU. China’s pride, as we’ve discussed, makes them resistant to public pressure, and the EU’s political differences with the U.S. complicate matters. A breakdown in talks could reignite fears, pushing sentiment toward anxiety and beyond.
- Bond Market Dynamics: Rising Treasury yields reflect growing unease among investors, with some foreign holders stepping back from U.S. debt. A continued rise in yields alongside falling stock prices could signal a broader retreat from U.S. assets, accelerating the cycle’s downward phases.
These factors suggest the market is vulnerable to a shift from complacency to deeper fear, potentially driving a larger correction before a true bottom forms.
Navigating the Cycle: Strategies for Investors
Understanding where we are in the cycle can guide investment decisions. Here’s how to approach 2025’s uncertainty:
- Stay Cautious During Complacency: The current bounce may tempt investors to buy, but the chart warns against it—complacency often precedes steeper declines. Waiting for signs of panic, where fear peaks, could offer better entry points.
- Prepare for Volatility: As the cycle progresses, expect sharper swings. Traders can use real-time tools to catch short-term moves, while long-term investors should focus on resilience.
- Protect Your Portfolio: Assets like gold or inflation-protected bonds can provide stability—they’ve held up in past downturns. Companies with strong fundamentals may weather the storm better than speculative names.
- Keep Cash on Hand: Liquidity is key—cash allows you to capitalize on opportunities when the market hits a true low, often marked by capitulation.
I’ve seen cycles play out—patience often pays off more than chasing early rallies. In 2025, timing matters.
Final Thoughts: The Cycle’s Not Done
At Vorpp Capital, we see the “Wall St. Cheat Sheet” as a powerful guide to 2025’s market turmoil. The S&P’s correction since February has taken us through fear, and now we’re in complacency—a phase that rarely marks the end. The cycle of investor psychology—from euphoria to capitulation—suggests more emotional twists ahead. Economic slowdown, geopolitical unrest, trade uncertainties, and bond market signals all point to a market that hasn’t hit rock bottom. While inflation is coming down, the U.S. money supply contraction raises the specter of deflation and recession, risks that could deepen the cycle’s downward leg. The chart reminds us that true lows come with panic and surrender, not a quiet pause. For now, caution is the name of the game—gold, bonds, and cash can anchor you while the market works through its feelings. The bottom will come, but the cycle says we’re not there yet.
Do not consider this article as financial advice. We only showcase our own opinion. Always do your own due diligence before investing in alternative (volatile) investment opportunities.
Access all free resources.
- Vorpp Trading Mastery: Free explainer videos to understand and learn trading basics. From understanding the markets to specific technical analysis, this is your entrance into the World of Trading.
- Access to TradeOS: Get our custom-built trading Journal that helps you structure your strategy and stay consistent.
- Passive Investing Guide: Master the principles of long-term wealth building with our easy-to-follow video course.
- Our eBook Trading – The Biggest Mind Game in the World: Understand the mindset behind success in the markets.
- No credit card. No risk. Just value: Click below and become a free member of Vorpp today.


